
 Available in US
Content

The Most Popular NFL Prop in UK Betting Shops
The anytime touchdown scorer market is the single most-bet NFL prop among UK punters I know, and it is also the prop where the worst expected value typically lives. Roger Goodell has spoken about London supporting not just one franchise but two — that level of UK interest is exactly what fills the touchdown scorer ticket every Sunday. The mechanics are intuitive to anyone with a football betting background. You pick a player, you back him to score, you collect if he reaches the end zone. The trap is that the prices are set with a heavy house margin and the public flows almost entirely toward the same few household names.
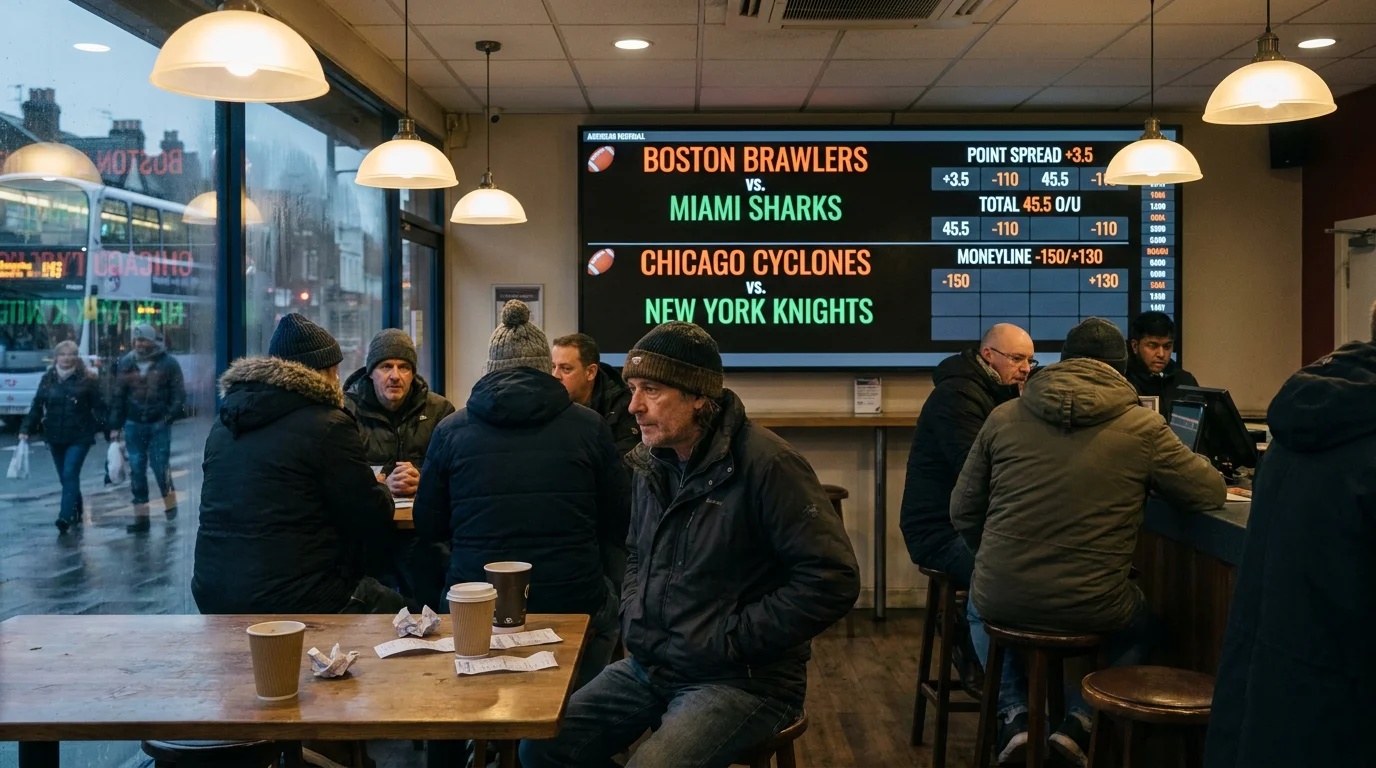
The UK gambling industry generated £4.5 billion of GGY in Q4 2025 including lotteries, and a meaningful share of NFL prop handle flows through anytime touchdown markets. Live football remained the most popular sport for UK betting in Q1 2025 at 6% of all UK adults — NFL is the secondary sport for many of those same bettors, and the touchdown scorer ticket is their entry point.
How Touchdown Scorer Prices Are Actually Built
Bookmakers price anytime touchdown markets by combining a player’s expected touches in scoring territory with the team’s projected total points. A receiver who sees 6 red-zone targets and 18 carries near the goal line over the past four weeks gets a shorter price than a receiver who sees 1 red-zone target and 0 carries near the goal line. The team total matters because a team projected for 27 points generates roughly 3 touchdowns, distributed across maybe 4-6 plausible scorers.

The maths is unforgiving. A team projected for 27 points implies roughly 3.0 touchdowns, of which perhaps 2.4 are scored by skill-position players (the remainder being kicker FGs combined with touchdown drives ending in kneels). That 2.4 expected touchdowns get distributed across the top 5-6 scoring candidates, so the leading candidate’s true scoring probability is roughly 38-44%. The implied probability at typical -120 odds is 55%. The price has built-in margin, and the margin compounds across multi-leg parlays.
Same-game multis built on anytime touchdown scorer markets are the worst-priced area of the entire NFL board. Three touchdown scorer legs at typical prices produce a cumulative implied probability that overstates true joint probability by 15-20%. UK punters drawn to the round-figure payouts of these tickets — a £10 stake returning £200 plus — are paying double vig on each leg.
Red-Zone Share Is the One Stat That Actually Forecasts Hits
Red-zone share is the percentage of a team’s plays inside the opponent’s 20-yard line that go to a specific player. It is the cleanest single predictor of anytime touchdown scorer success, and it is dramatically more reliable than total target share or carry count.
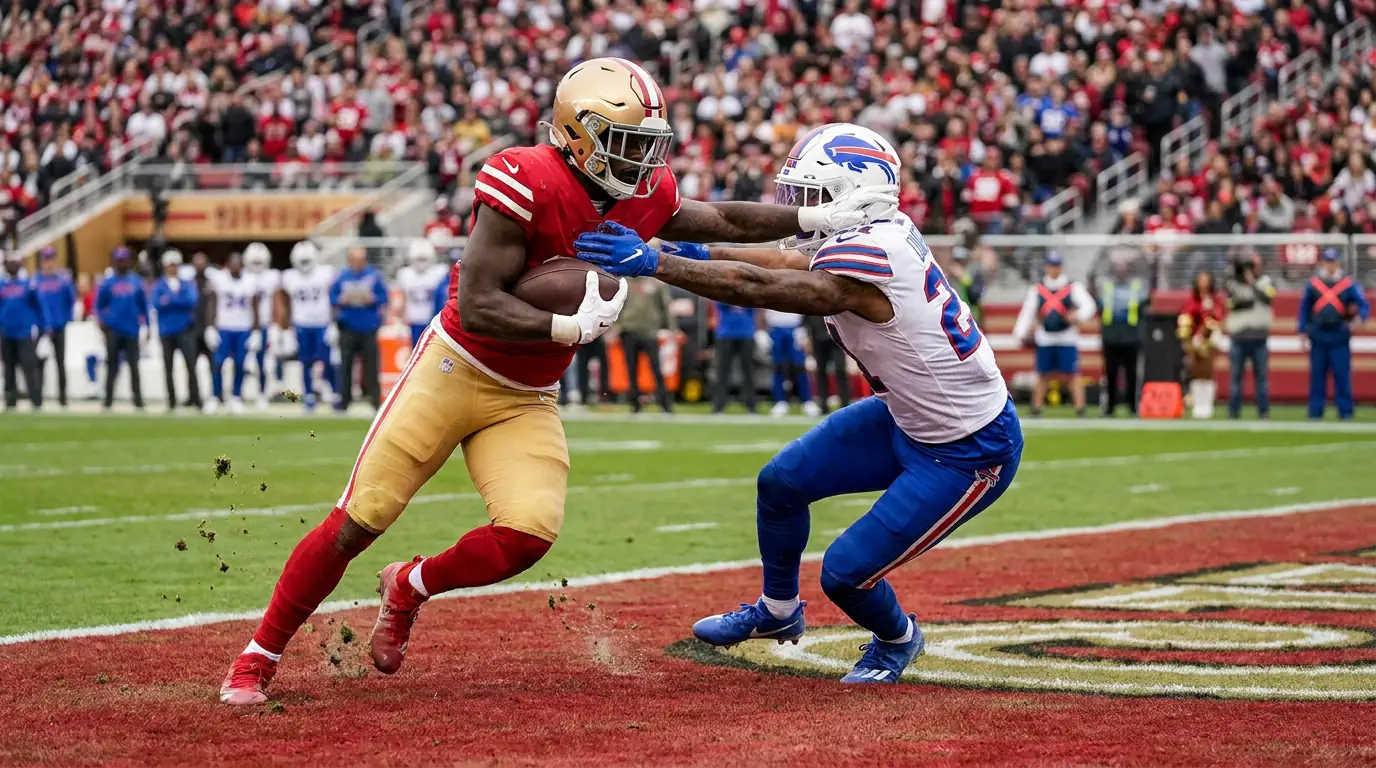
A workhorse back with 60%+ red-zone carry share is a player whose anytime TD price typically sits at +120 to +160. The fair value on most of those backs is closer to +110, which means the price is honest and the bet is roughly neutral expected value. Where the value appears is the secondary red-zone weapon — the tight end with 25% red-zone target share, the goal-line specialist back, the slot receiver who gets the fade-route call inside the 5. These players price at +250 to +500 when their true scoring probability is closer to +200 to +300.
I look for two things. Red-zone target share above 20% for non-RB players. Red-zone carry share above 40% for RBs. These thresholds identify players who are scheme-designed to score, not players who happen to score occasionally. The prices on these specific players hold up against the top-name market favourites in expected value terms, and they outperform across a season of disciplined ticketing.
First Versus Anytime Versus Last Touchdown Scorer
The three touchdown scorer markets — first, anytime and last — are priced very differently and require different mental models. First touchdown scorer is essentially a random-event market with weighted probabilities. Anytime touchdown scorer is the cleanest probability bet of the three. Last touchdown scorer is the rarest and most random, because it depends on which team has the ball in the closing minutes and which player they hand it to.
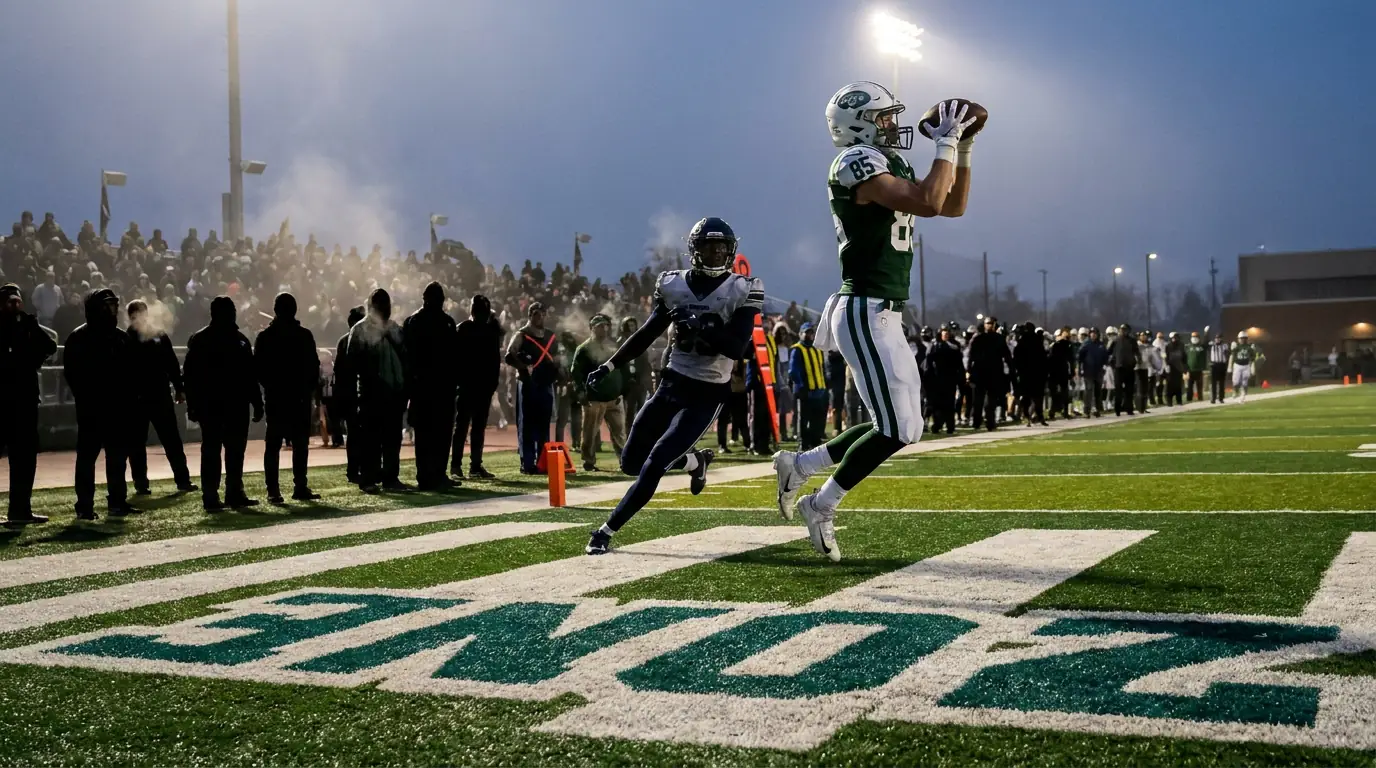
First touchdown scorer prices typically range from +400 for the favoured RB to +2000 for fringe candidates. The maths is roughly anytime probability divided by the expected number of touchdowns in the game. A team scoring 3 TDs means the leading RB’s first-TD probability is roughly his anytime probability divided by 3, which lands at +400 to +500. The price is fair on the surface, but the variance is enormous and the strategy on first-TD requires consistent ticketing across many games rather than picking individual spots.
Last touchdown scorer is rarely sharp. The market exists because punters enjoy it, not because there is sustained value in either direction. The exception is the late-game garbage-time touchdown by a backup RB in a blowout — a scenario UK punters can occasionally identify when the spread is 14+ points and the second-string RB has been on the field for the previous two series. Even then the edge is small and the variance is huge.
The Goal-Line Back Spot Books Get Wrong
Goal-line specialist backs are the single most consistently mispriced position on the touchdown scorer card. These are short-yardage backs who are not the team’s lead rusher but who get the carry inside the 3-yard line. Their anytime touchdown prices typically sit at +400 to +800 when their true scoring probability is closer to +250 to +500.
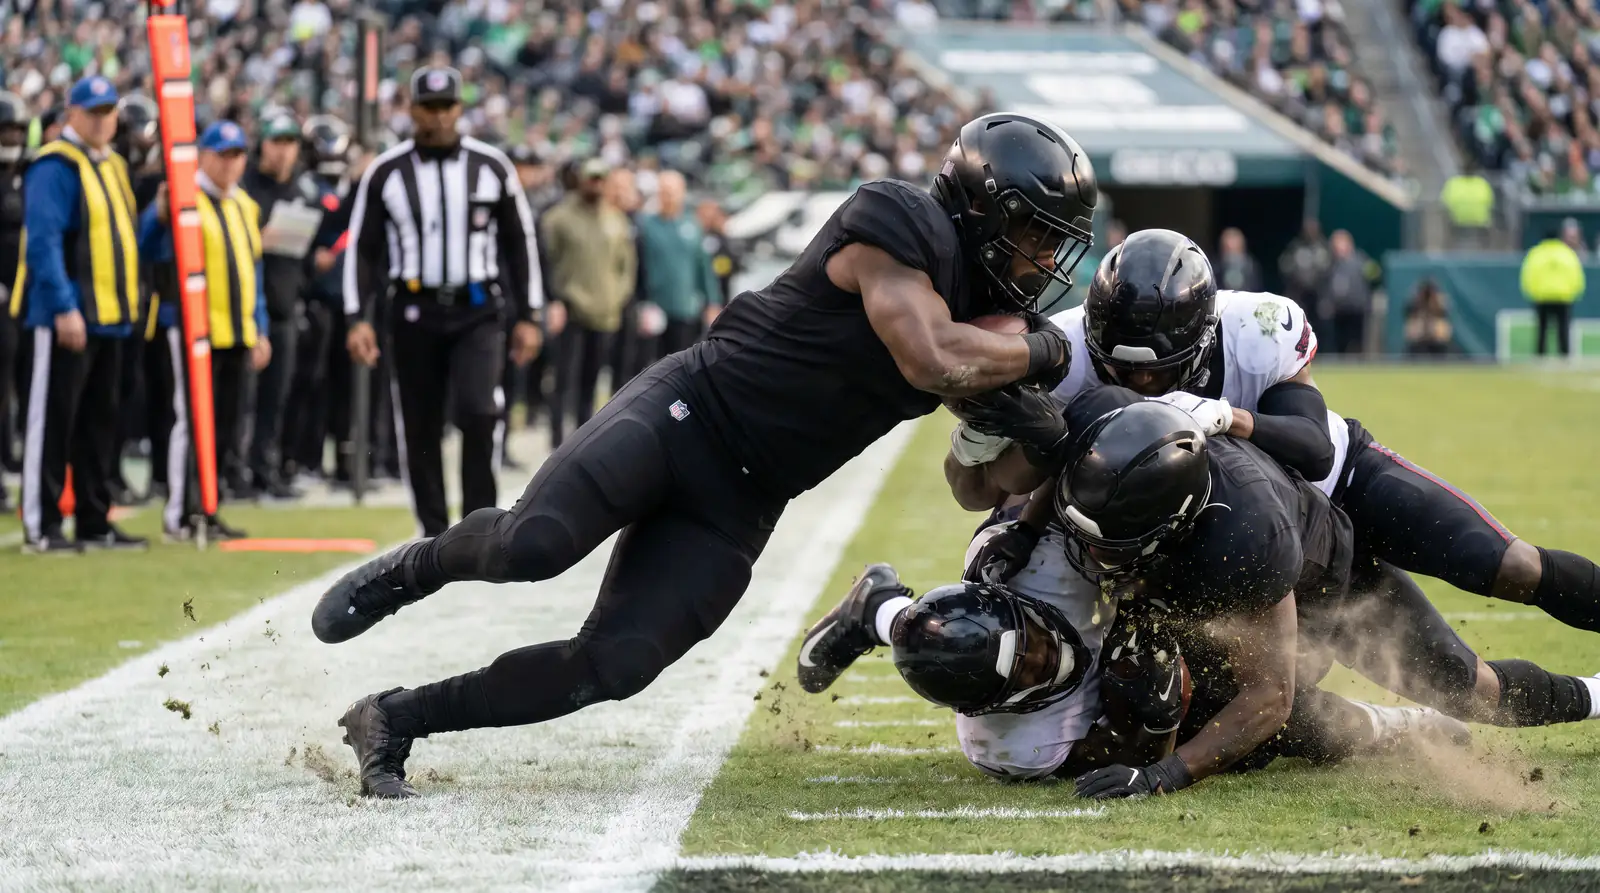
The mispricing comes from market psychology. Public bettors back names they recognise — the lead RB, the star receiver, the franchise QB. The goal-line back gets less action because his name is less familiar, so the price drifts longer than the true probability supports. UK punters can find these spots by checking each team’s red-zone carry distribution across recent weeks. Any back who has received 2+ carries inside the 5-yard line over the past three weeks is a goal-line spot, regardless of his usage on early downs.
The bet I look for is the goal-line specialist whose team is favoured by 5+ points at home with a team total over 26. The favourable game script supports red-zone trips, the team total supports touchdowns rather than field goals, and the back’s role supports him scoring rather than someone else. The combined probability is usually well above the +500 typical price.
Correlation With the Total Is the Bet Most UK Punters Miss
The total in an NFL game is structurally correlated with touchdown scorer outcomes. A high total — 48+ points — implies more touchdowns and therefore more scoring opportunities for each candidate. A low total — sub-42 — implies fewer touchdowns and a higher proportion of field goals to touchdowns inside the scoring zone. The correlation is significant but not always priced into individual scorer markets.
The bet I look for is the anytime touchdown scorer over plus the game total over. Both legs are correlated to the same underlying scenario — a high-scoring game with multiple touchdown drives — so they move together. The bookmaker prices the joint probability roughly as if the legs were independent, which means the joint price is fair to slightly favourable on the over-over side.
The reverse trap is anytime touchdown scorer plus total under, which is structurally backwards. A low-scoring game means fewer touchdowns for every potential scorer. Combining the two legs into a same-game multi gives the bookmaker double the margin without any genuine value to the punter. UK punters who instinctively reach for total-under as the safer side of every multi are paying for that instinct on touchdown scorer markets.
The receiving prop foundation that drives most red-zone targets and therefore most touchdown scoring probabilities — target share, shadow coverage, tight end edges — is unpacked across the full UK angle on receiving yards props from a British punter’s perspective.
Why are kickers excluded from anytime touchdown scorer?
Kickers don’t score touchdowns. They score field goals and extra points. The anytime touchdown scorer market only counts players who carry the ball into the end zone, catch a pass for a touchdown, or recover a touchdown on defence. Kickers are excluded by definition. The closest market for kicker scoring is the kicker points or kicker field goals over/under, which is priced separately and trades on the projected number of attempted field goals — a different variable from the touchdown probability that drives the scorer market.
Are first touchdown scorer markets ever sharp?
Rarely. The first touchdown is essentially a random-event market with weighted probabilities, and the variance is enormous. A back with a 30% anytime touchdown probability has roughly a 12-15% first-touchdown probability, but the typical +400 to +500 price implies 17-20%. The price is structurally short. The exception is when a clear primary scoring threat — a true workhorse back with 70%+ red-zone carry share — is available at +600 or longer, which sometimes happens in the early week before sharp money corrects the line. Outside that specific spot, first touchdown scorer is closer to a recreational bet than a positive expected value play.
