
 Available in US
Content
The Prop That Lives or Dies on Carry Count
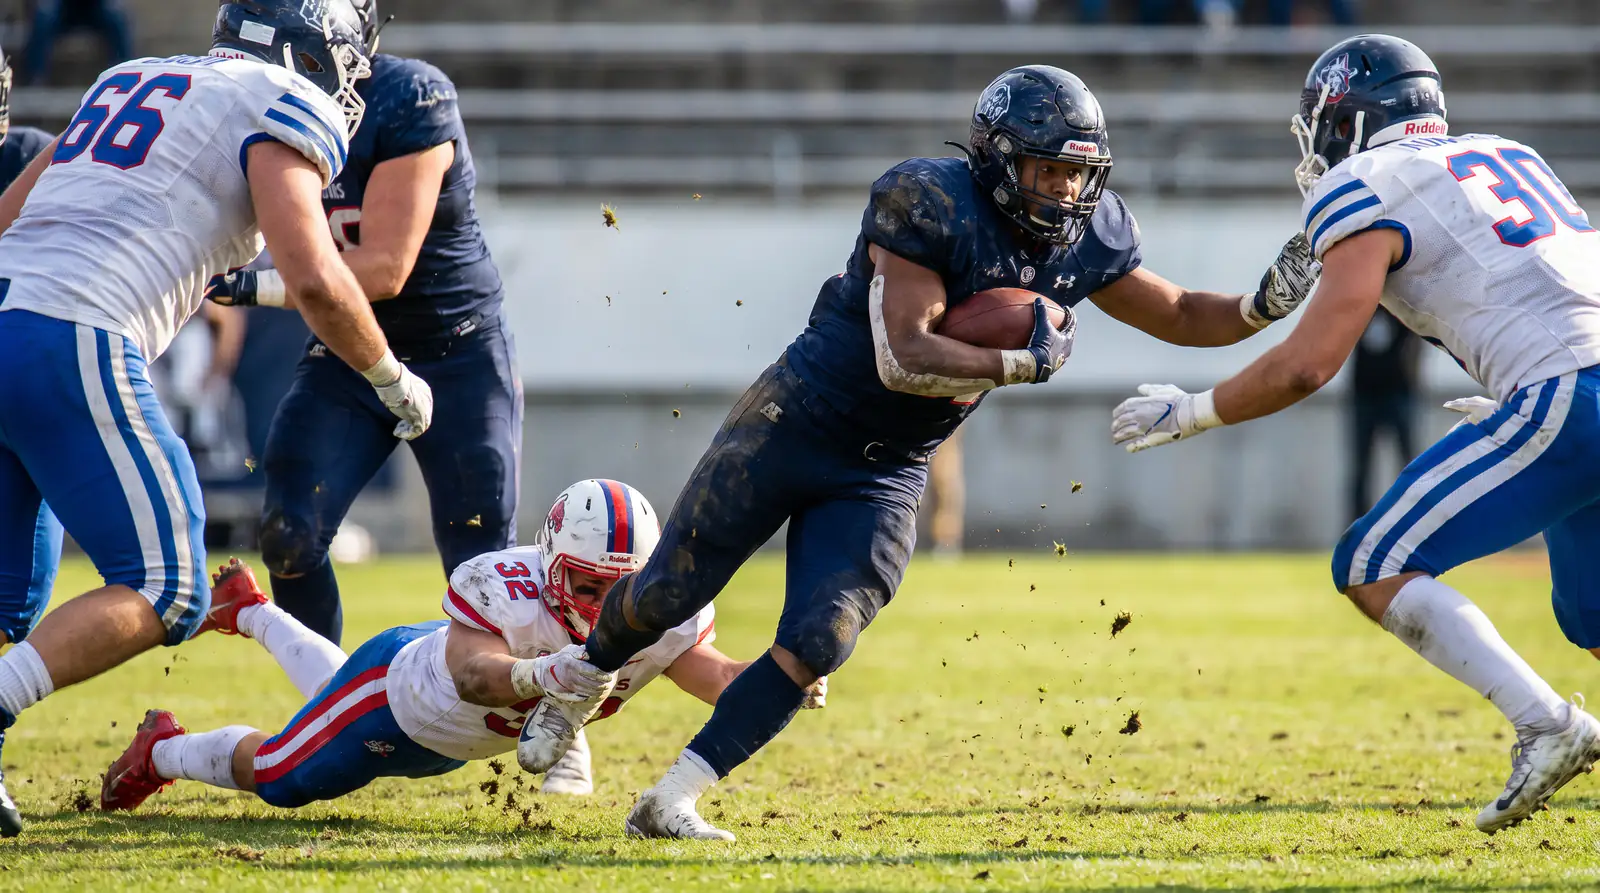
My worst losing month on NFL props came from chasing rushing-yards overs. I had read the matchups correctly. I had read the defensive splits correctly. What I had failed to read was the workload share, and that single oversight wiped out half my bankroll across a four-week stretch. Rushing-yards props are not won on the back’s talent or the defensive front — they are won on carry count, and carry count is the data point UK punters routinely underweight.

Online betting on live sporting events in the UK generated £596 million of GGY in Q4 2024/25, and rushing props sit inside the same prop universe as QB and receiving props. The difference is volatility: a rushing line can be wrecked by a single missed series, where a passing line is rarely killed by a single dropped pass.
Usage Share Is the Only Stat That Matters Before You Bet
Usage share is the percentage of a team’s rushing attempts that go to a specific running back. Books price rushing props off projected usage share, and the lines move sharply when usage share is uncertain. Workhorse backs in the 70%-plus share band get rushing lines in the 70-90 yard zone. Committee backs in the 45%-65% share band get lines in the 50-65 yard zone. Third-down or change-of-pace backs in the 25%-40% band get lines in the 25-40 yard zone.
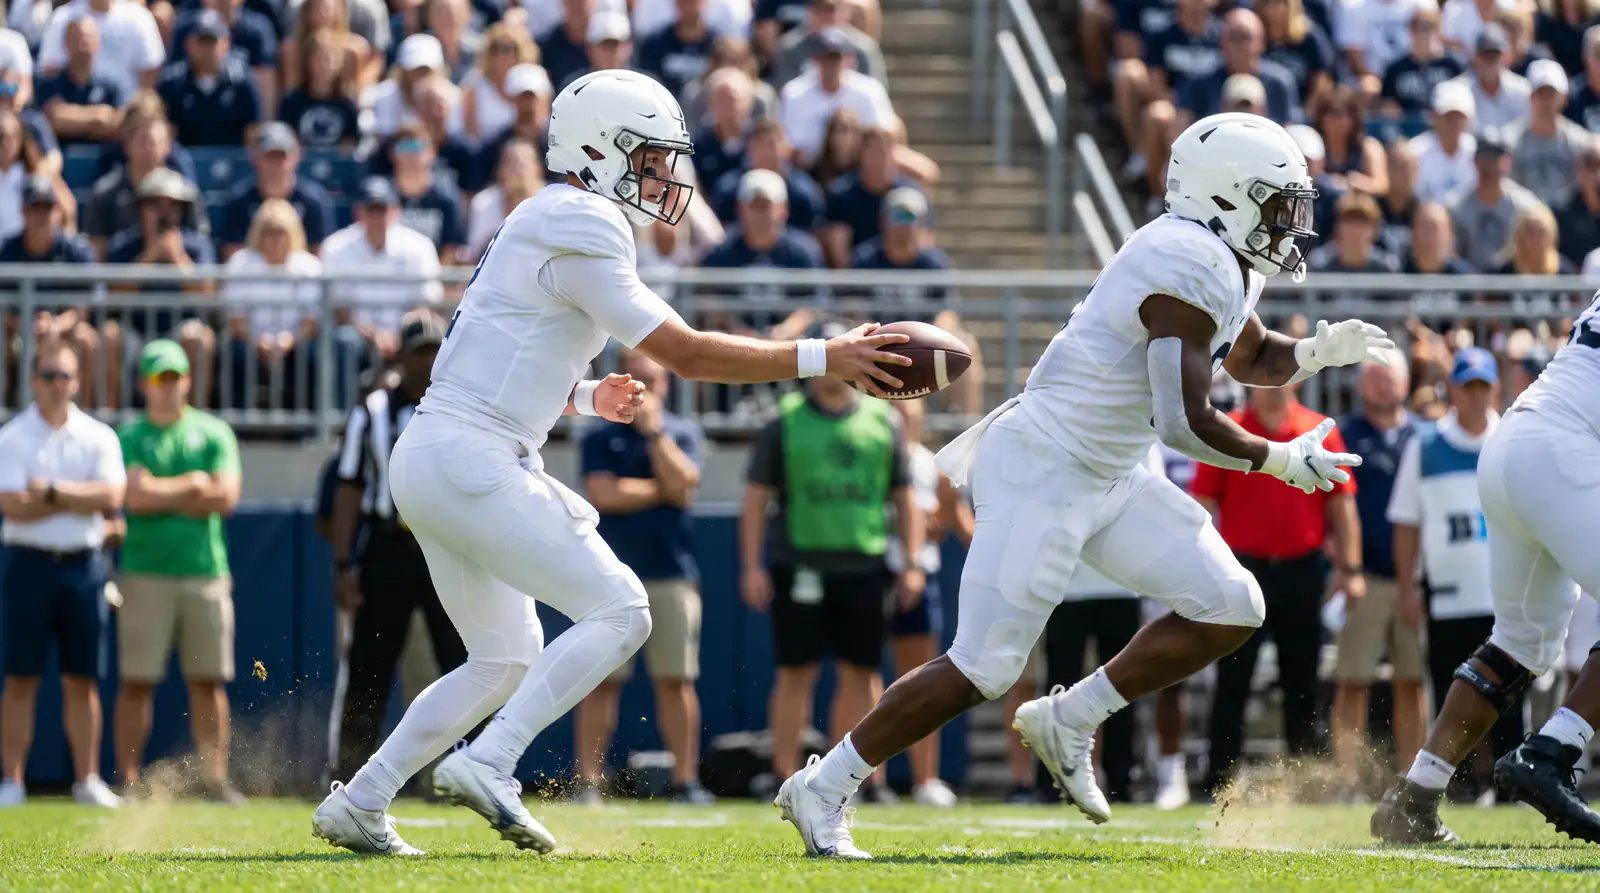
The mistake UK punters make is assuming that a back’s lifetime stats predict usage in any given game. They do not. A back’s coach decides usage based on game plan, injuries to teammates, and his own preferences about who finishes drives. A back who averages 18 carries per game can finish with 8 carries if the team is trailing by two touchdowns at halftime, or with 26 carries if the team is leading by two touchdowns at halftime.
The first thing I check before any rushing prop is the previous three weeks of carry counts for that specific back. Trend matters more than season average. A back trending from 14 to 17 to 20 carries is a back the coach is feeding more, and his rushing line is structurally vulnerable to the over even if the season average suggests otherwise.
Game Script Overlays Everything
Game script is the projected flow of the match — who leads, by how much, when. For rushing props the relationship is inverted from passing props: leading teams run more, trailing teams run less. A team favoured by 7 points is implicitly forecast to lead in the second half and run the clock, which inflates the favoured RB’s rushing volume by 4-6 carries relative to a neutral script.

This is the bet I look for. A workhorse back on a team favoured by 6+ points at home, playing a defence that gives up better than 4.5 yards per carry, with a clear top role in the backfield. The line is typically set conservatively because books are wary of pricing in game script too aggressively. The over hits at a rate well above the breakeven of the -115 typical price.
The reverse trap is just as important. Backing a rushing over on a team that is a 3+ point underdog is a bet against game script. The line might look soft, but the carry count rarely arrives in negative game scripts because the team starts passing in the second half. Even a 100-yard-line back can finish with 12 carries for 48 yards in a game where his team trails 17-3 at halftime.
Offensive Line and the Matchup That Actually Counts
Defensive run rate against the rush gets quoted constantly on UK betting podcasts, and it matters less than the offensive line up front. A back behind a top-five offensive line averages roughly 4.7-5.2 yards per carry. The same back behind a bottom-five offensive line averages 3.8-4.2 yards per carry. The line-quality differential is the single biggest factor in rushing efficiency, and it is more stable across the season than defensive rankings.
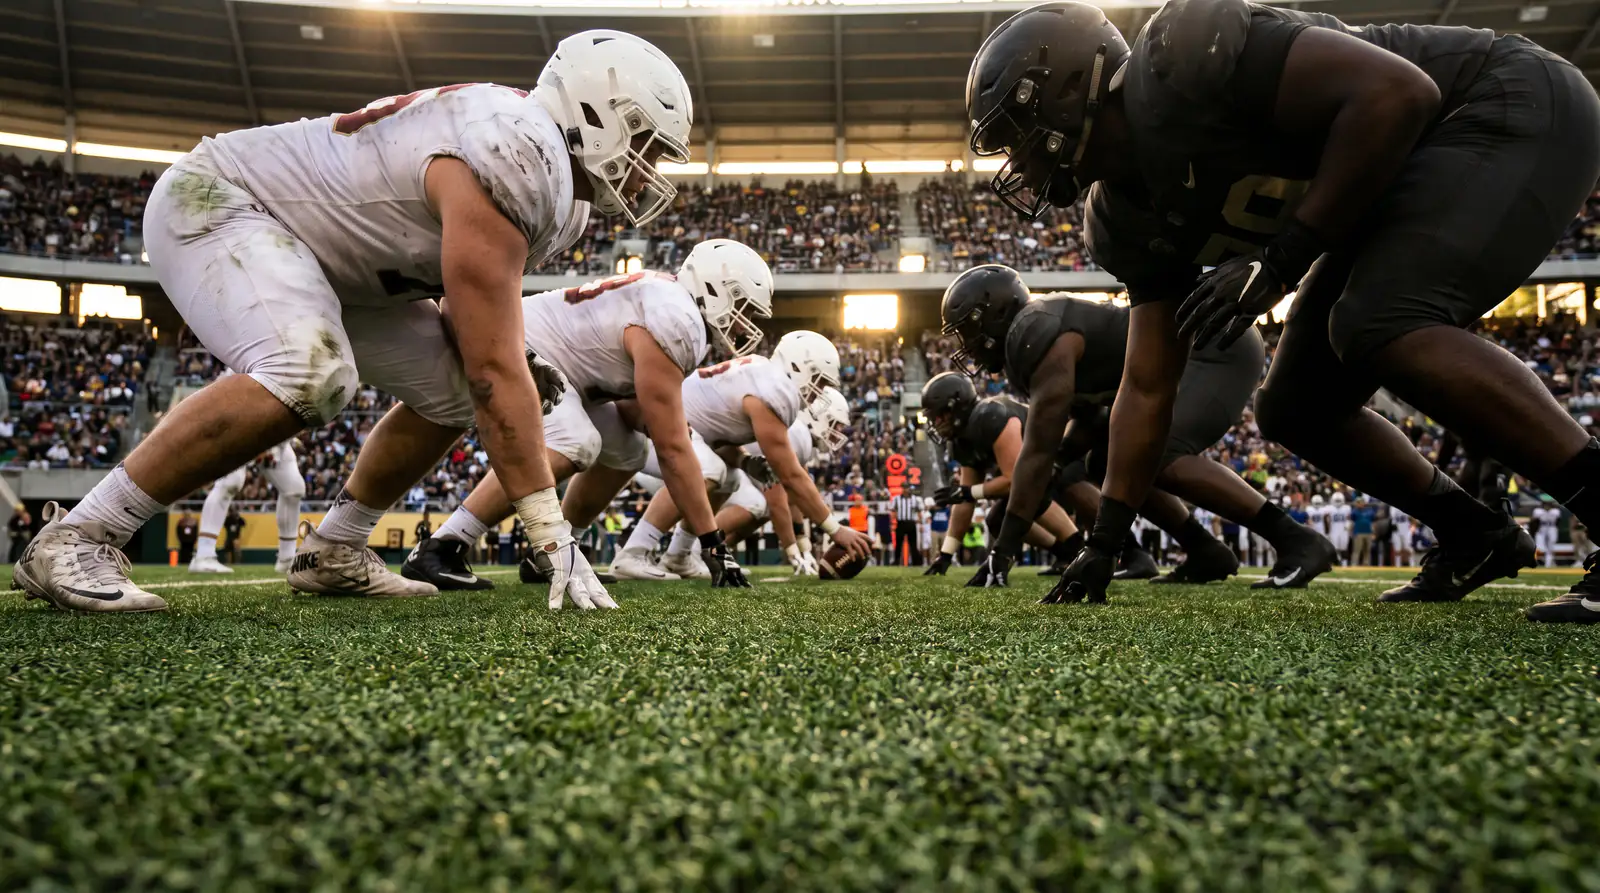
The defensive matchup matters most in extreme spots. A back facing a top-three run defence is structurally compromised. A back facing a bottom-five run defence gets a real efficiency boost. In the middle — defences ranked 10th through 22nd — the matchup is roughly neutral, and the prop comes down to volume rather than yards per carry.
The matchup overlay UK punters miss most often is play-action defence. A back’s quarterback’s effectiveness on play-action passing creates better second-level looks for the rushing attack. Teams with elite play-action passing produce rushing efficiency boosts of 0.4-0.6 yards per carry — small in isolation but meaningful across a 20-carry game. The Rams, Vikings and Bills have all benefited from this dynamic in recent seasons.
Longest Rush Props Are a Different Animal
Longest rush props are priced very differently from yardage props. The line typically sits in the 16-22 yard zone, and the distribution is skewed by the possibility of a single breakaway run. Backing the over is a bet that one rush in the game will exceed the line, regardless of how many other rushes are stopped at the line of scrimmage.
The maths is unintuitive. A back with 20 carries averaging 4.5 yards per carry has a longest-rush distribution centred around 19-22 yards, with a long right tail. The line sits at the median, which means the over is genuinely a coin flip at fair odds — and the typical price of +105 to +120 leaves a small house margin.
The bet I look for is the longest-rush over on a back with breakaway speed against a defence that has given up multiple 20+ yard runs in recent weeks. The volatility favours the over because the distribution has a long tail, and the volume on the back’s team supports enough carries to give the breakaway run a chance to happen.
Committee Backfields Are the Reason This Prop Card Has House Edge
Committee backfields are the prop bettor’s nightmare. A backfield split 50/40/10 between three backs produces rushing lines that are individually beatable but collectively a wash, because the snap distribution is uncertain even to the coaching staff.

The pattern to recognise is the offensive coordinator’s tendency. Some coaches commit to a workhorse and ride him for 20+ carries. Others rotate aggressively, mixing change-of-pace usage with goal-line specialist roles. Knowing which coach you are betting into is more important than knowing which back you are betting on. The Detroit Lions under their current staff have rotated between two backs for years, splitting carries 60/40 with goal-line touches going to a third option. The Indianapolis Colts have committed to a single back. The Kansas City Chiefs have varied year by year.
The bet to avoid is any rushing prop on a committee back when the alternative back is healthy. The bet to look for is a rushing prop on a workhorse back when the alternative is injured or inactive, because that is the spot where the bookmaker has not yet repriced the line. Inactive lists drop 90 minutes before kickoff, and the books update the rushing line accordingly — but live cash-out timing and pre-game prop sharpness diverge in this window, which is where UK punters with a fast read can find genuine edge.
The other side of the offensive prop card — the passing-game volume that game script drives the same way — is in the QB-focused breakdown on UK pricing of passing yards, TDs and interception markets.
How does a committee backfield destroy rushing props?
By making the line accurate at the team level and unbeatable at the individual level. A team’s total rushing yards are predictable, but the distribution across two or three backs is not. A back who got 16 carries last week can get 9 this week without any change in the team’s overall game plan. The bookmaker has access to coaching reports and snap counts and sets the line conservatively, so the over and under are both close to 50/50 propositions at -110 to -115. The expected value across many bets is slightly negative because of the vig, and the variance is much higher than for workhorse backs. Backing committee backs is a recipe for high-variance break-even results at best.
Should I bet rushing overs when a team is favoured?
In most cases yes, especially when the favourite is at home and the spread is 5 or more points. Leading teams run more in the second half to control the clock, which inflates the workhorse back’s carry count by 4-6 attempts above a neutral game script. The combined effect on the yardage line is typically 15-25 yards of upside, which is usually larger than the price the bookmaker has built into the line. The exception is a heavy favourite playing a defence that is genuinely strong against the run — in that spot the carry count is high but the per-carry efficiency is low, and the over becomes a coin flip rather than a structural lean.
